Sales Operations Dashboard
Real-Time Visibility for Your Team

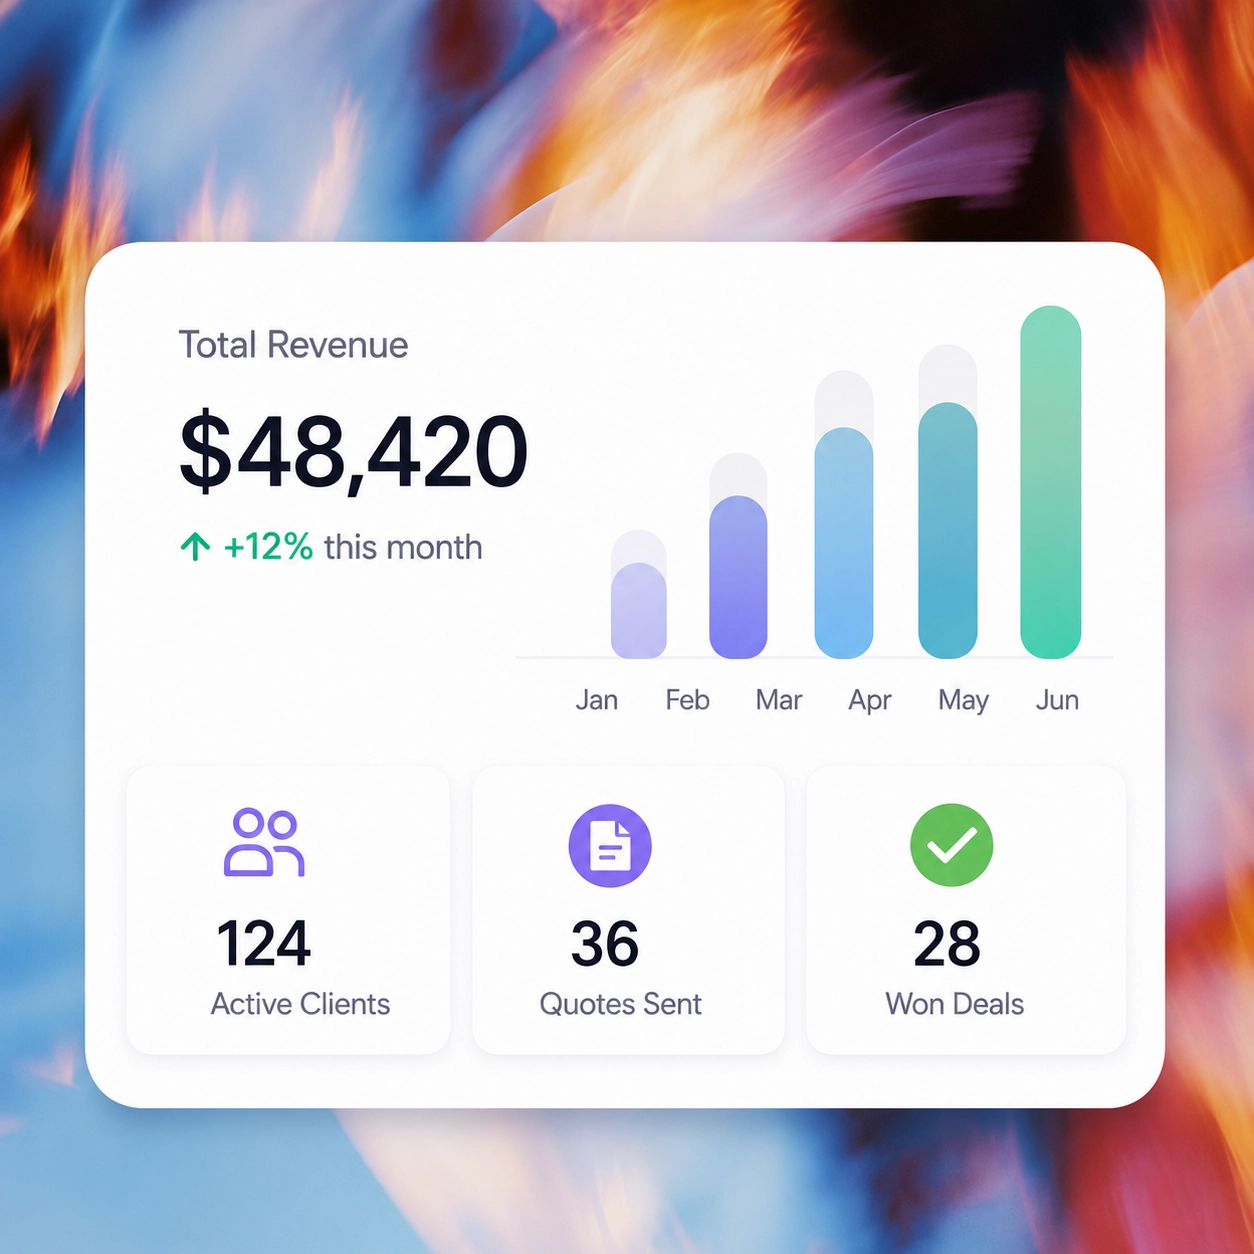
A sales operations dashboard built around how your team actually sells: pipeline, revenue, and rep performance, all in one live view.

Supported By

NVIDIA sponsorship
Microsoft for startups
Client Logo 1
Client Logo 2
Client Logo 3
Client Logo 4
Client Logo 5
Client Logo 1

Why "AI-Driven" Software Still Isn't Fixing Your Operations

What a Sales Operations Dashboard Actually Does

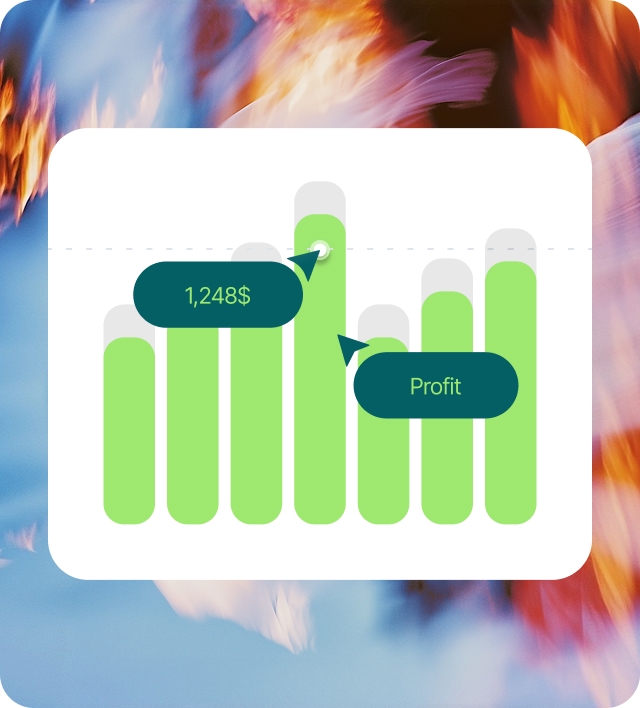
A sales operations dashboard brings pipeline stage, revenue against target, and individual rep activity into a single screen that updates as deals move, instead of a static report someone rebuilds every week. 


The average salesperson still loses 13 hours a week, or 28% of the work week, to admin tasks (SuperOffice, citing Salesforce’s State of Sales research), most of it work a live dashboard removes entirely.


What it typically includes:

Pipeline stage tracking

Daily or weekly progress against the month's number, not a surprise on the 30th

Revenue vs. target view

Auto-updates, appointment reminders, and client follow-ups delivered where your customers actually read messages, not buried in an email they'll open next week.

Rep-level performance metrics

Calls made, follow-ups completed, deals closed, per person

Lead source breakdown

which channels actually convert, so ad spend and outreach effort go where they work

Automated alerts

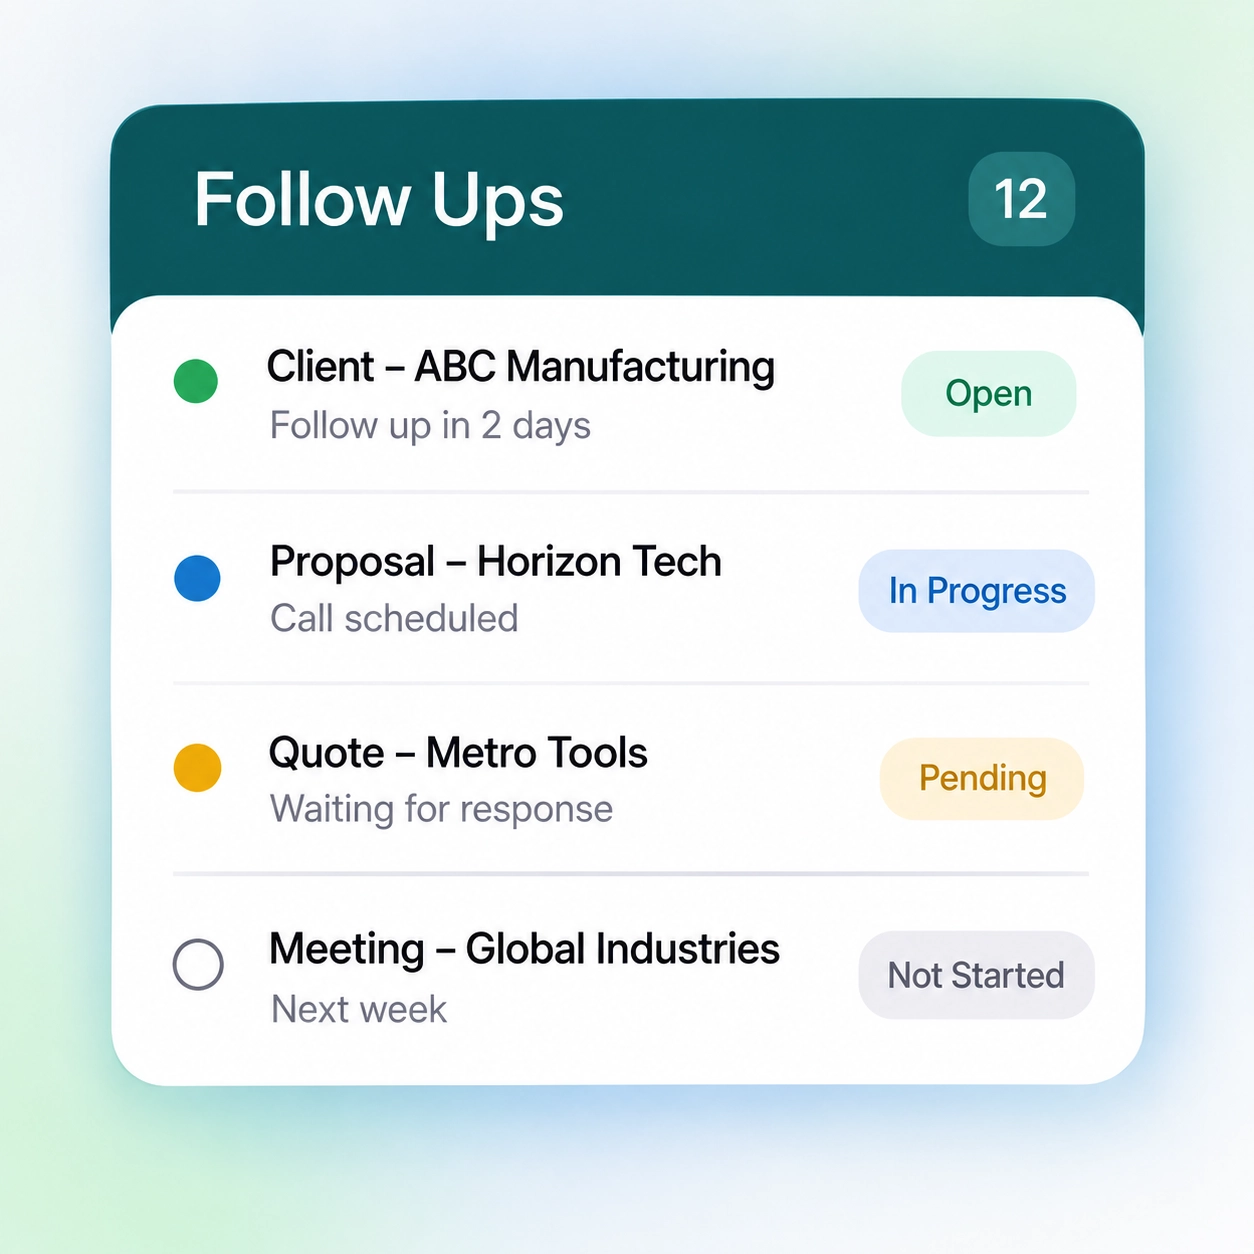
A stalled deal or a missed follow-up flagged before it goes cold

Mobile access

For reps in the field or a founder checking numbers between meetings

Custom KPI widgets

Built around the specific metrics that matter to this business, not a generic template

Team and individual views

So a founder sees the whole pipeline while a rep sees just their own accounts, without building two separate systems

How Does This Actually Get Built?

It starts with mapping how the sales team actually works, not dropping a pre-built template on top of whatever CRM exists today. Dhumi’s process is built around three facts that hold across every build:

  • 2–3 weeks to a working MVP
  • 3 scoped tiers based on business size and complexity
  • Monthly, effort-based partnership after launch

Sellers spend only 40% of their time actually selling (Salesforce’s 2026 State of Sales report), the rest is admin, and a dashboard that isn’t built around the team’s real process just becomes one more screen to maintain. 


That’s the reasoning behind starting with a process map instead of a feature list.

How Does Dhumi's Sales Operations Dashboard Process Work?

Week 1

Map the sales process

Dhumi reviews how leads move through the CRM, WhatsApp, and Excel to identify visibility gaps and manual handoffs.


Week 1-2

Build the working dashboard

Pipeline, revenue, and rep metrics get built against the real data sources identified in week one, not a generic template. The layout reflects the specific KPIs this team actually reviews in a weekly sales meeting.

Week 2-3

Connect the data sources

CRM, invoicing, and communication tools get wired in so the dashboard updates on its own instead of needing manual refreshes. Where legacy spreadsheet data needs to move into the new system, it gets cleaned and migrated as part of this same step.

Ongoing

Monthly iteration

As the business changes, a new product line, a new region, a new KPI leadership wants tracked, the dashboard evolves through the monthly partnership rather than a fresh project scope each time.

Why Growing Teams Choose Dhumi for Their Small Business Dashboard

gradient-border

Built Around Your Workflow

Not a pre-set template, the dashboard reflects how this specific team sells, not a generic SaaS layout

case icon
gradient-border

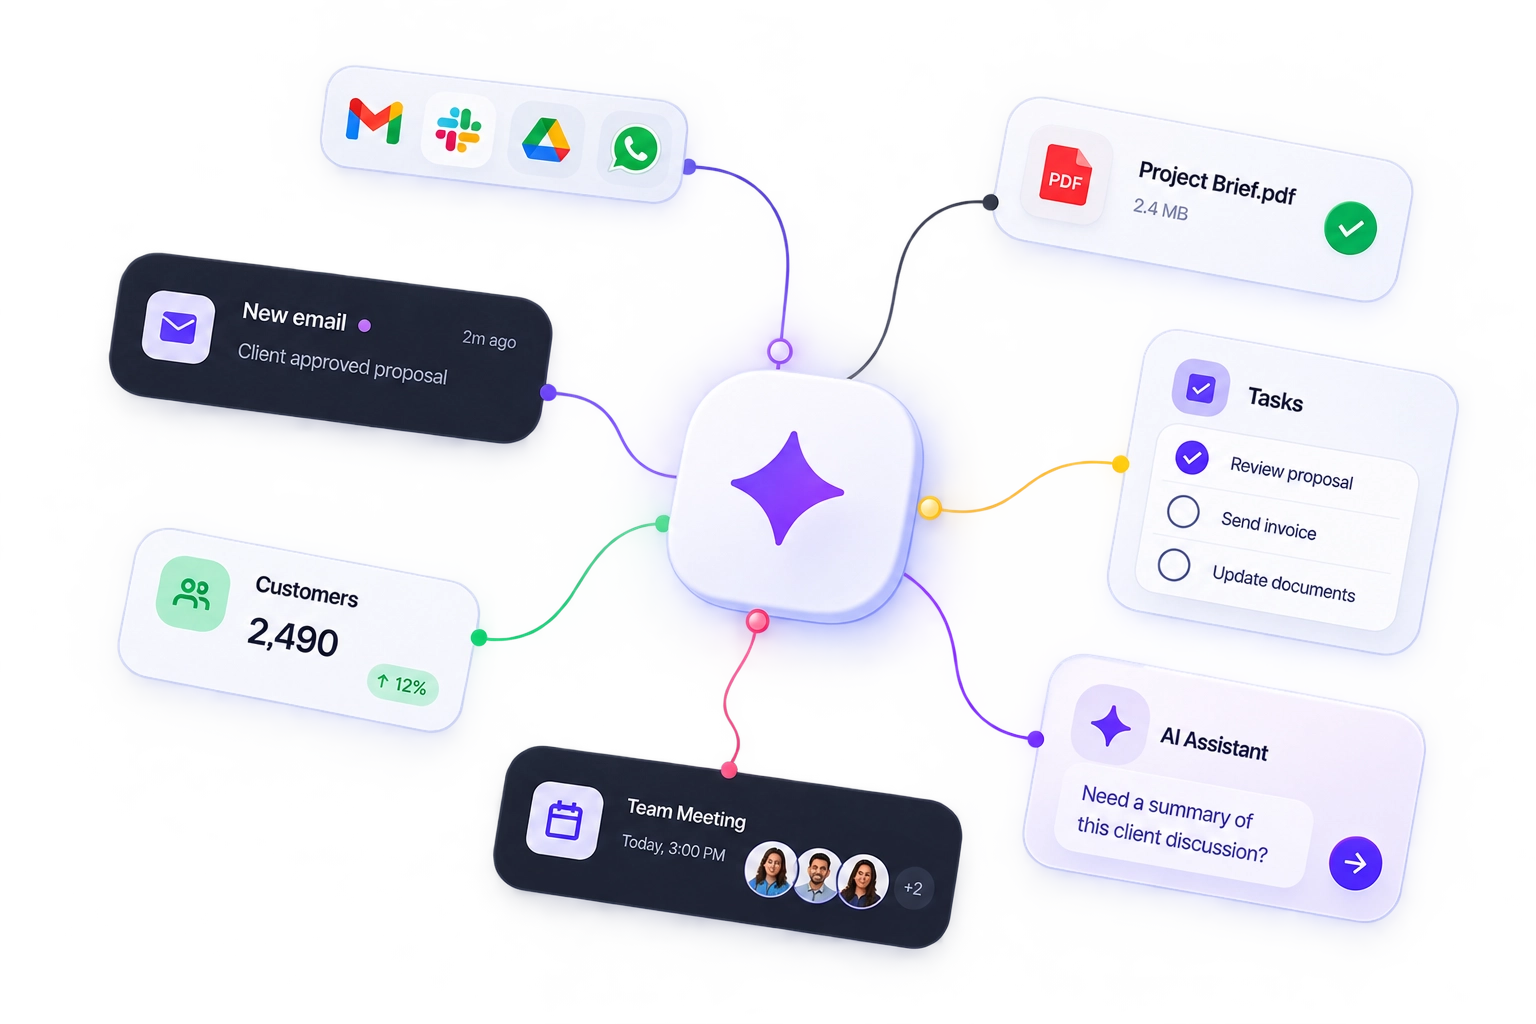
AI embedded in the process

Not bolted on as a separate subscription, deal updates, lead scoring, and alerts happen inside the same system
case icon
gradient-border

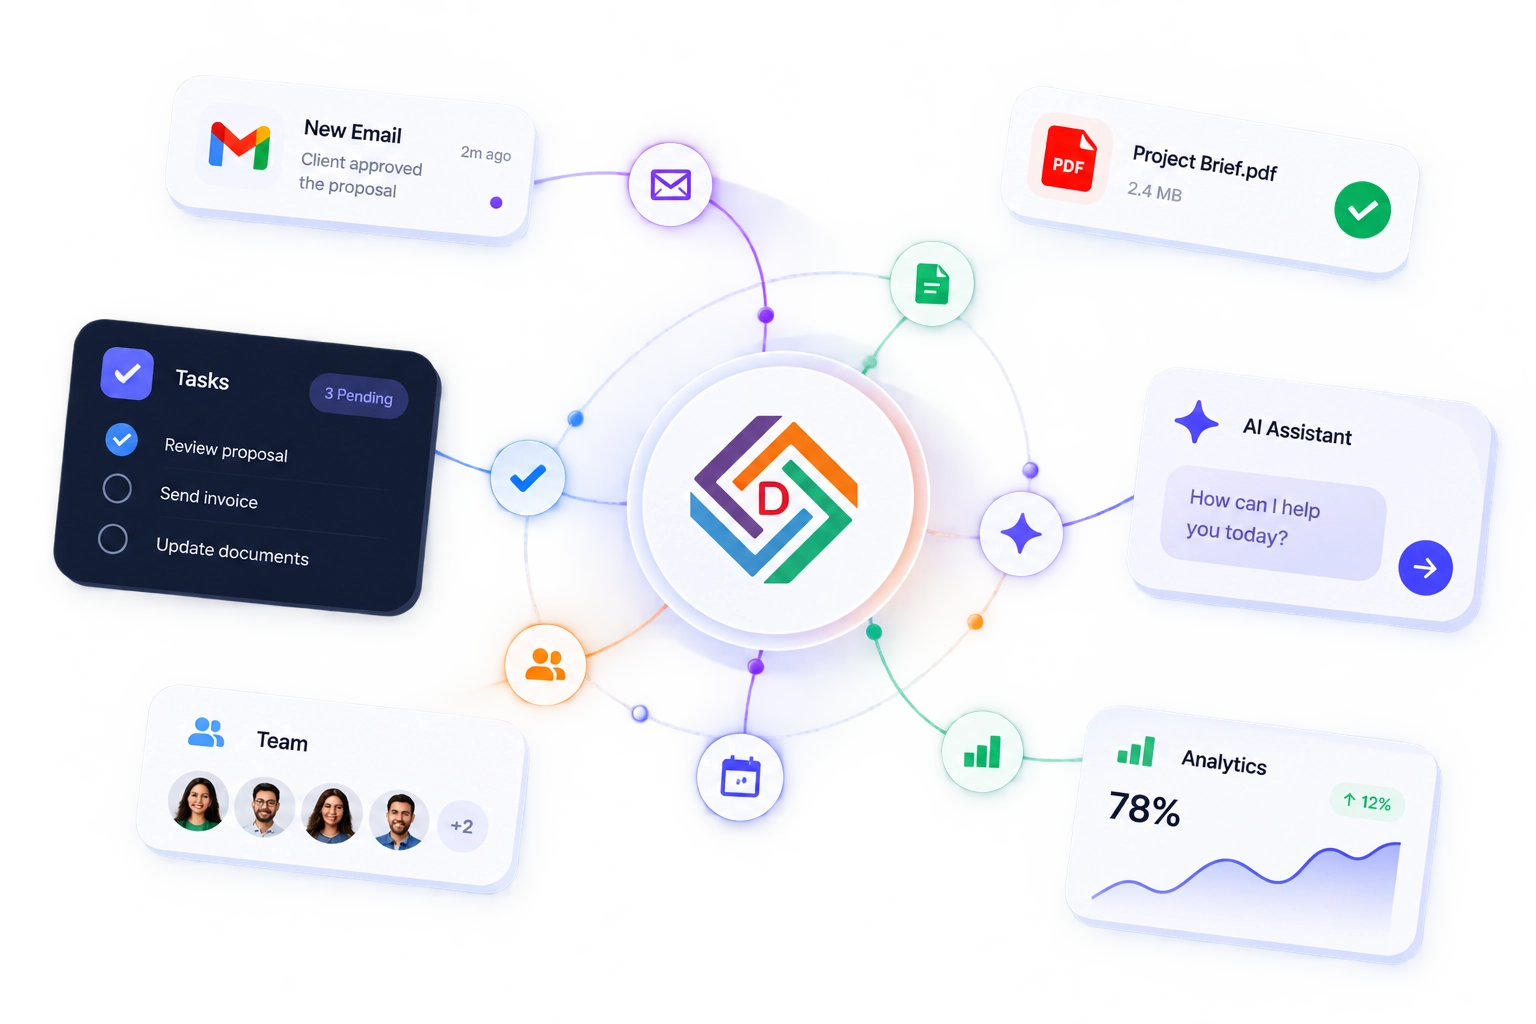
One connected platform

Instead of a dashboard tool sitting on top of three disconnected systems
case icon
gradient-border

Transparent monthly partnership

Not a one-off build that goes stale six months later

case icon

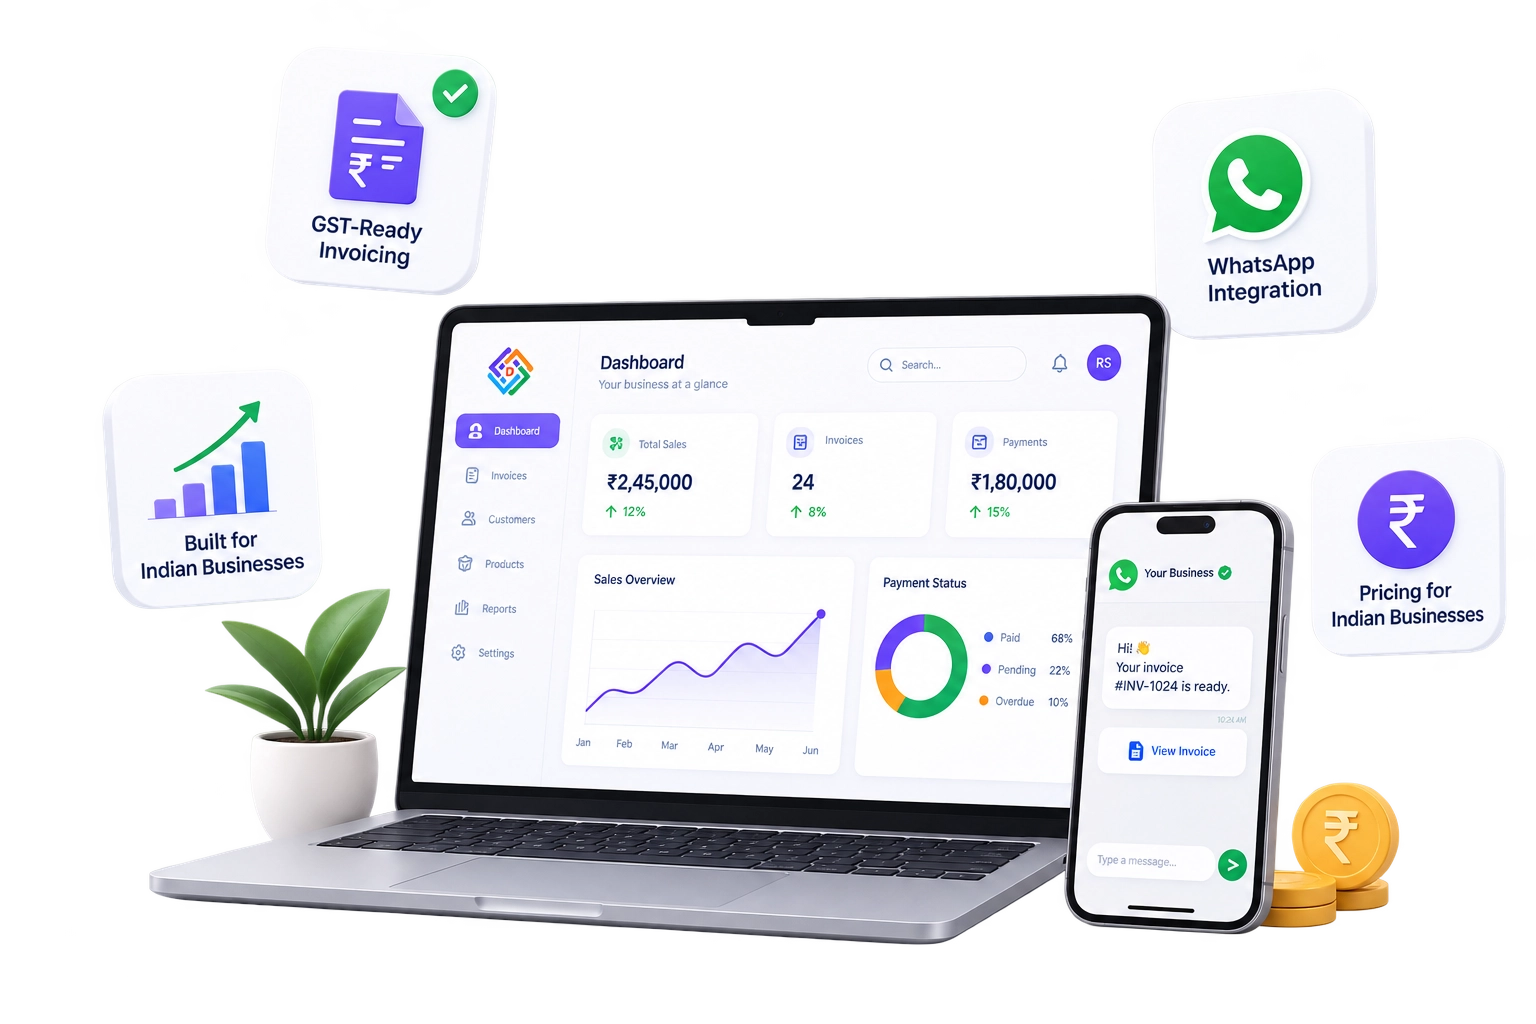
Clear, upfront tier scoping

A real answer to what's included at each level, not a "book a demo to find out
case icon

Data migration handled as part of the build

So old spreadsheet history doesn't get left behind when the dashboard goes live

Which Plan Fits Your Sales Operations Dashboard

A sales operations dashboard is typically built as part of Dhumi’s Business Systems for SMBs tier. Teams that also need AI agents, WhatsApp automation, or a broader connected operating platform on top of the dashboard usually move into AI Platform 360. Both are scoped month-to-month plans, so the fit depends on data sources, team size, and which KPIs the dashboard needs to track.

What's included Best for
Business Systems for SMBs A team that needs pipeline, revenue, and rep visibility without a broader platform rebuild .
AI Platform 360 A team that wants the dashboard plus AI agents and connected communication layers

Not sure which tier fits your operation? Let’s talk it through.

Get a Sales Operations Dashboard Built Around How Your Team Actually Sells

A dashboard deserves its spot only if it displays the numbers a team truly needs. It should update automatically, so no one has to chase after the data. Dhumi first maps the real sales process. Then, it builds the dashboard on top. You can expect it live in 2–3 weeks and see monthly updates after that.

Frequently Asked Questions About AI Powered Solutions

A sales operations dashboard is a single view that pulls together pipeline stage, revenue against target, and rep activity so a sales manager or founder can see how the sales process is actually performing without checking multiple systems.

A CRM report is usually a static export someone pulls and rebuilds by hand. A dashboard updates automatically as deals change. This keeps the numbers current without needing to re-run a report.

If multiple people need sales updates, like an owner, a manager, and a rep, a dashboard simplifies things. It cuts out the need for constant check-ins. Nearly half of businesses under 10 employees still don’t use a CRM at all (OfficeClip, 2026), which is usually the real starting point before a dashboard makes sense.

Dhumi’s dashboards are typically built as part of the Business Systems for SMBs tier, or as part of AI Platform 360 if AI agents and broader automation are needed. Pricing is scoped monthly based on data sources, team size, and the KPIs the dashboard needs to track, so it’s best worked out in a direct conversation.

 Dhumi builds a working MVP in 2–3 weeks, based on the actual sales process, not a template. The dashboard then evolves monthly as the business changes.

It works best connected to a CRM, since that’s where most pipeline and deal data lives. 1 in 4 small and medium businesses still manage sales through spreadsheets (OfficeClip, 2026), for those teams, Dhumi typically builds the CRM and dashboard together rather than layering a dashboard on top of scattered sheets.

A useful small business dashboard covers pipeline stage and value, revenue against target, and rep-level activity at minimum, anything beyond that should map to a real decision the business needs to make, not just a metric that looks good on screen.

Pipeline stage and value, revenue against target, rep-level activity (calls, follow-ups, closed deals), lead source performance, and stalled-deal alerts cover most small business needs, though the exact mix should reflect what this specific team is trying to improve, not a generic KPI list.